A Suspiciously Perfect Curve
Unitas Protocol is a stablecoin yield protocol deployed on Solana and BSC. Users deposit funds to mint the stablecoin USDu, then stake it as sUSDu to automatically earn yield. Since launching in August 2024, sUSDu has delivered positive returns for 19 consecutive months, never once posting a monthly loss. Its historical annualized yield has averaged around 12%–14%, peaking above 30% in its early days. In March 2026, Unitas completed its $UP token TGE, offering sUSDu holders additional points-based airdrop rewards on top of yield. Protocol TVL has grown from approximately $25M to nearly $100M.
Monthly returns have remained stable between 0.69% and 3.22%, with the curve rising smoothly regardless of market conditions. This is highly unusual.
There is no shortage of teams running similar delta-neutral strategies in Solana DeFi. Professional firms like Vectis, Gauntlet and Neutral Trade all manage comparable vaults on Drift, providing us with rich peer comparison data.
We tracked the performance of 10 similar JLP Delta Neutral vaults on Drift. Over the past 91 days, Jupiter JLP DN returned a cumulative +0.4%, Gauntlet hJLP returned +0.1%. Meanwhile, the strategy component of sUSDu (after removing USD1 campaign income) returned +1.6% over the same period, or +2.9% including USD1 income.
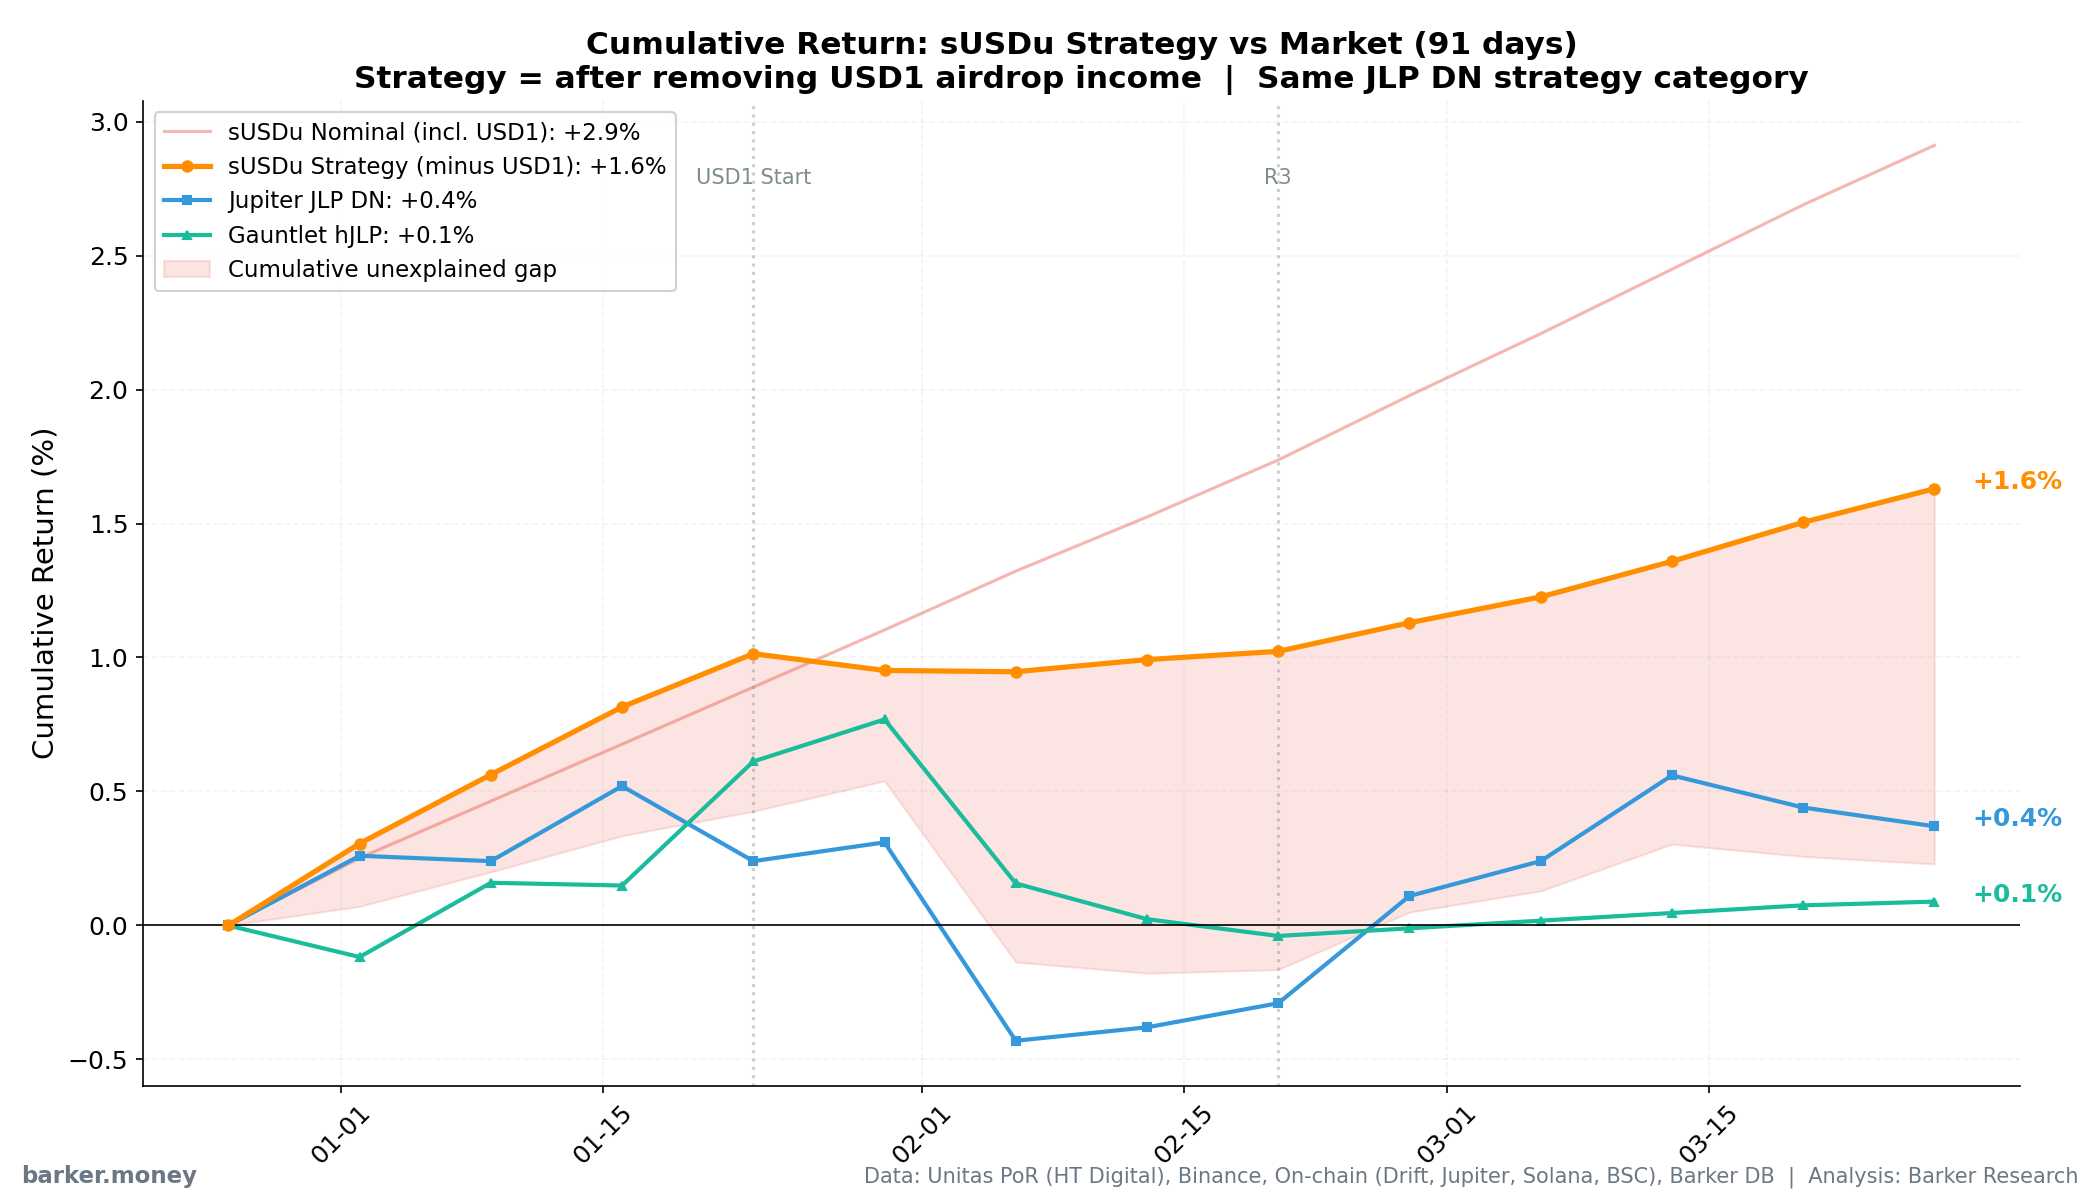
Chart: 91-day cumulative return comparison. The orange line (sUSDu strategy) rises smoothly, while the blue line (Jupiter) and green line (Gauntlet) fluctuate around zero. If they use the same strategy, these curves should look similar.
Running the same strategy, why is Unitas the only one that never loses?
How Unitas Makes Money
According to Binance's wallet page, Unitas is built on a JLP Delta Neutral arbitrage engine at its core, with all other collateral and hedging layers built on top. sUSDu yield comes primarily from three sources:
- JLP fee sharing (officially labeled as the primary revenue source): deploying funds into Jupiter's perpetual exchange liquidity pool (JLP) to earn trading fees
- Funding rate premium: shorting perpetual contracts to hedge price exposure in JLP, while collecting funding rate payments
- Protocol fees and other income: fees from minting/redemption/liquidation, plus potentially other strategy returns
In simple terms, this is a "market-neutral" strategy: no directional bets, just earning fees. In practice, however, hedging costs, funding rate volatility, and slippage all weigh on returns—which is why comparable strategies often see 30-day APY swing from -4.5% to +6.5%.
PoR audit data shows JLP comprised 56%–76% of collateral before the USD1 campaign launched, declining to 16%–25% afterwards as USD1 grew. Other assets include BTC, BFUSD, and various stablecoins.
Additionally, starting January 2026, Unitas began using USD1 to participate in Binance Earn campaigns. USD1 serves as both protocol collateral and a source of additional interest income from Binance. This has become a significant component of sUSDu yield (detailed in the next section).
Protocol revenue is distributed 80/10/10: 80% to sUSDu holders, 10% to the insurance fund, 10% to the treasury.
Breaking Down the 12%: How Much Comes from Strategy vs. USD1 Campaigns
Starting from Unitas's weekly PoR audit reports and exchange_rate data, we calculated the protocol's actual revenue week by week and separated out the USD1 Earn campaign interest contribution.
The results were surprising: Since the USD1 campaign launched, USD1 Earn interest has accounted for 52%–78% of total sUSDu revenue.
The chart below shows the change in collateral composition alongside two measures of APY:
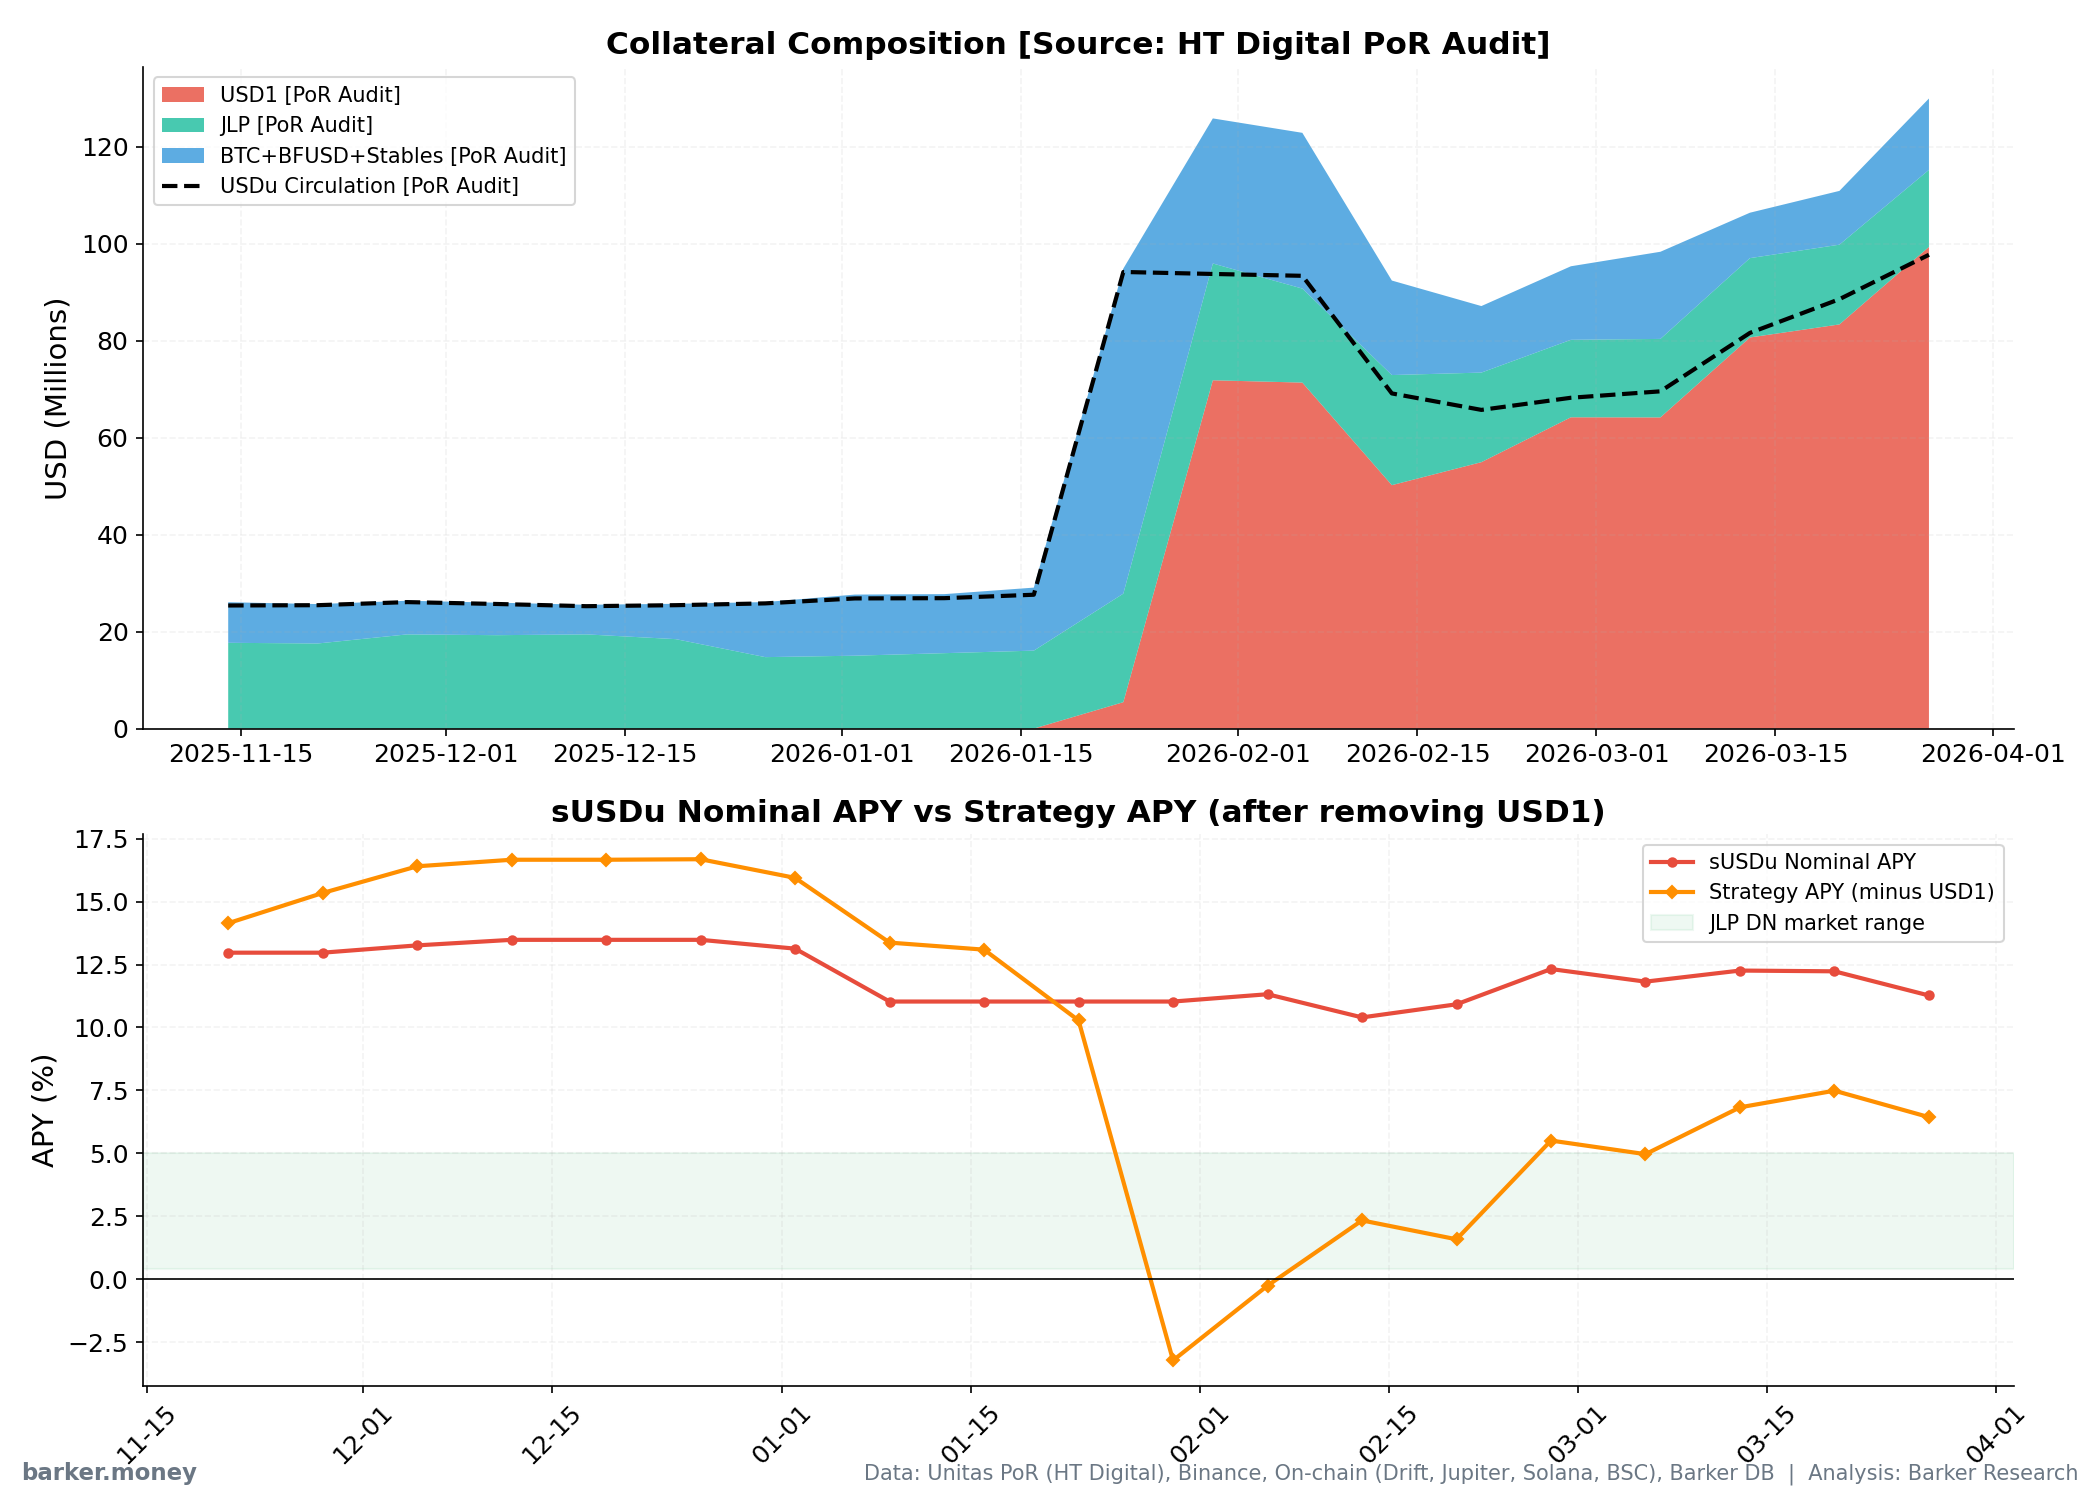
Top: PoR audit data showing collateral composition. USD1 (red) grew rapidly from January 2026, now comprising nearly 100% of collateral. Bottom: Red line = sUSDu nominal APY, blue line = strategy APY after removing USD1.
A note on the two lines in the bottom panel: Before the USD1 campaign (pre-January), the gap between the lines reflects the 80/10/10 revenue distribution, where 20% of total revenue goes to insurance and treasury, so the protocol needs to earn more on collateral than what users see. After the USD1 campaign launched, the gap is primarily driven by USD1 Earn interest. This additional income inflates the nominal APY but does not reflect strategy performance.
The weekly revenue breakdown makes this even clearer:
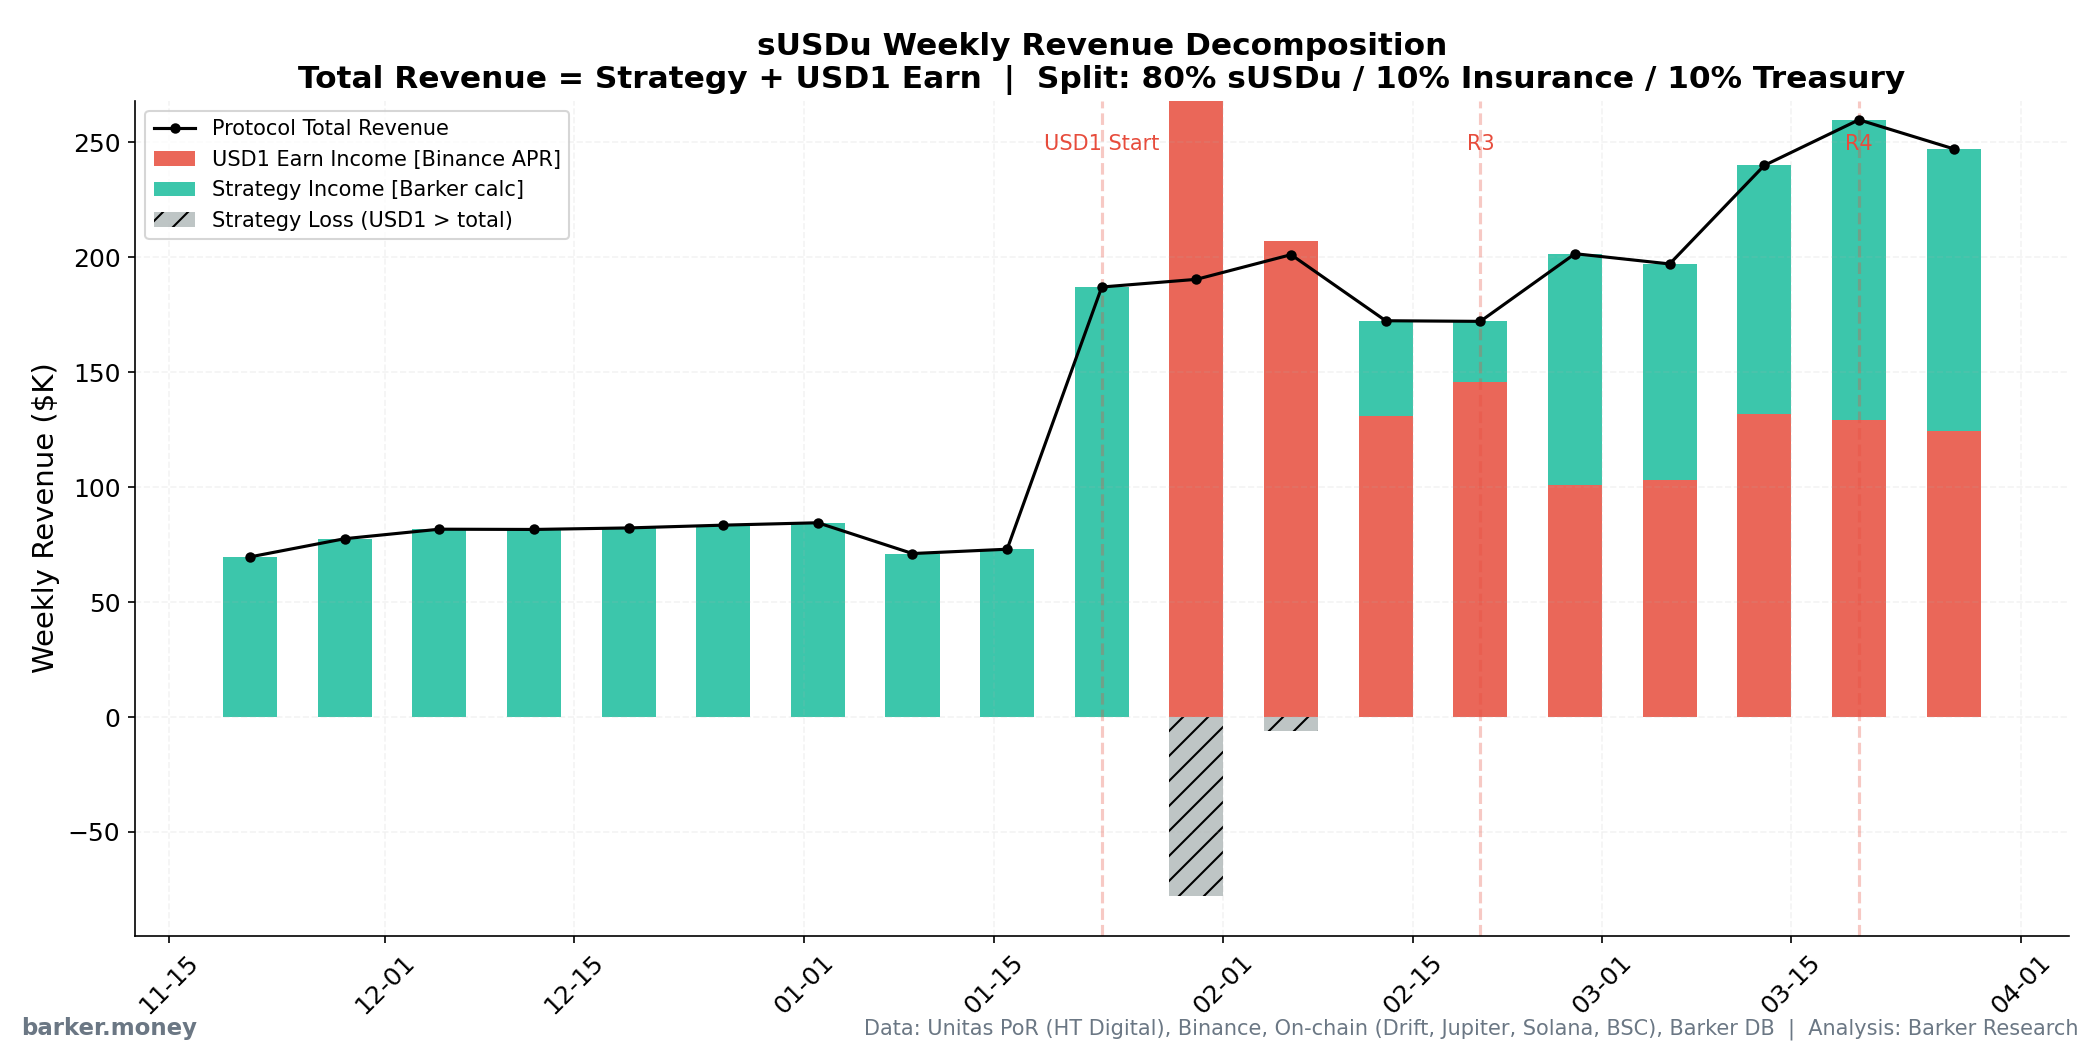
Chart: sUSDu weekly revenue decomposition. Red = USD1 Earn campaign interest, teal = strategy income, black line = total protocol revenue. In early February, USD1 interest actually exceeded total protocol revenue (diagonal hatched area).
Notably, the USD1 Earn campaign APR is declining rapidly, from 19.46% at launch to just 6.52% in the most recent period. The subsidy from USD1 campaigns is fading fast.
How Does It Compare to the Market?
We compared sUSDu against 10 JLP Delta Neutral vaults on Drift (including well-known teams like Vectis, Gauntlet and Neutral Trade) across multiple time windows:
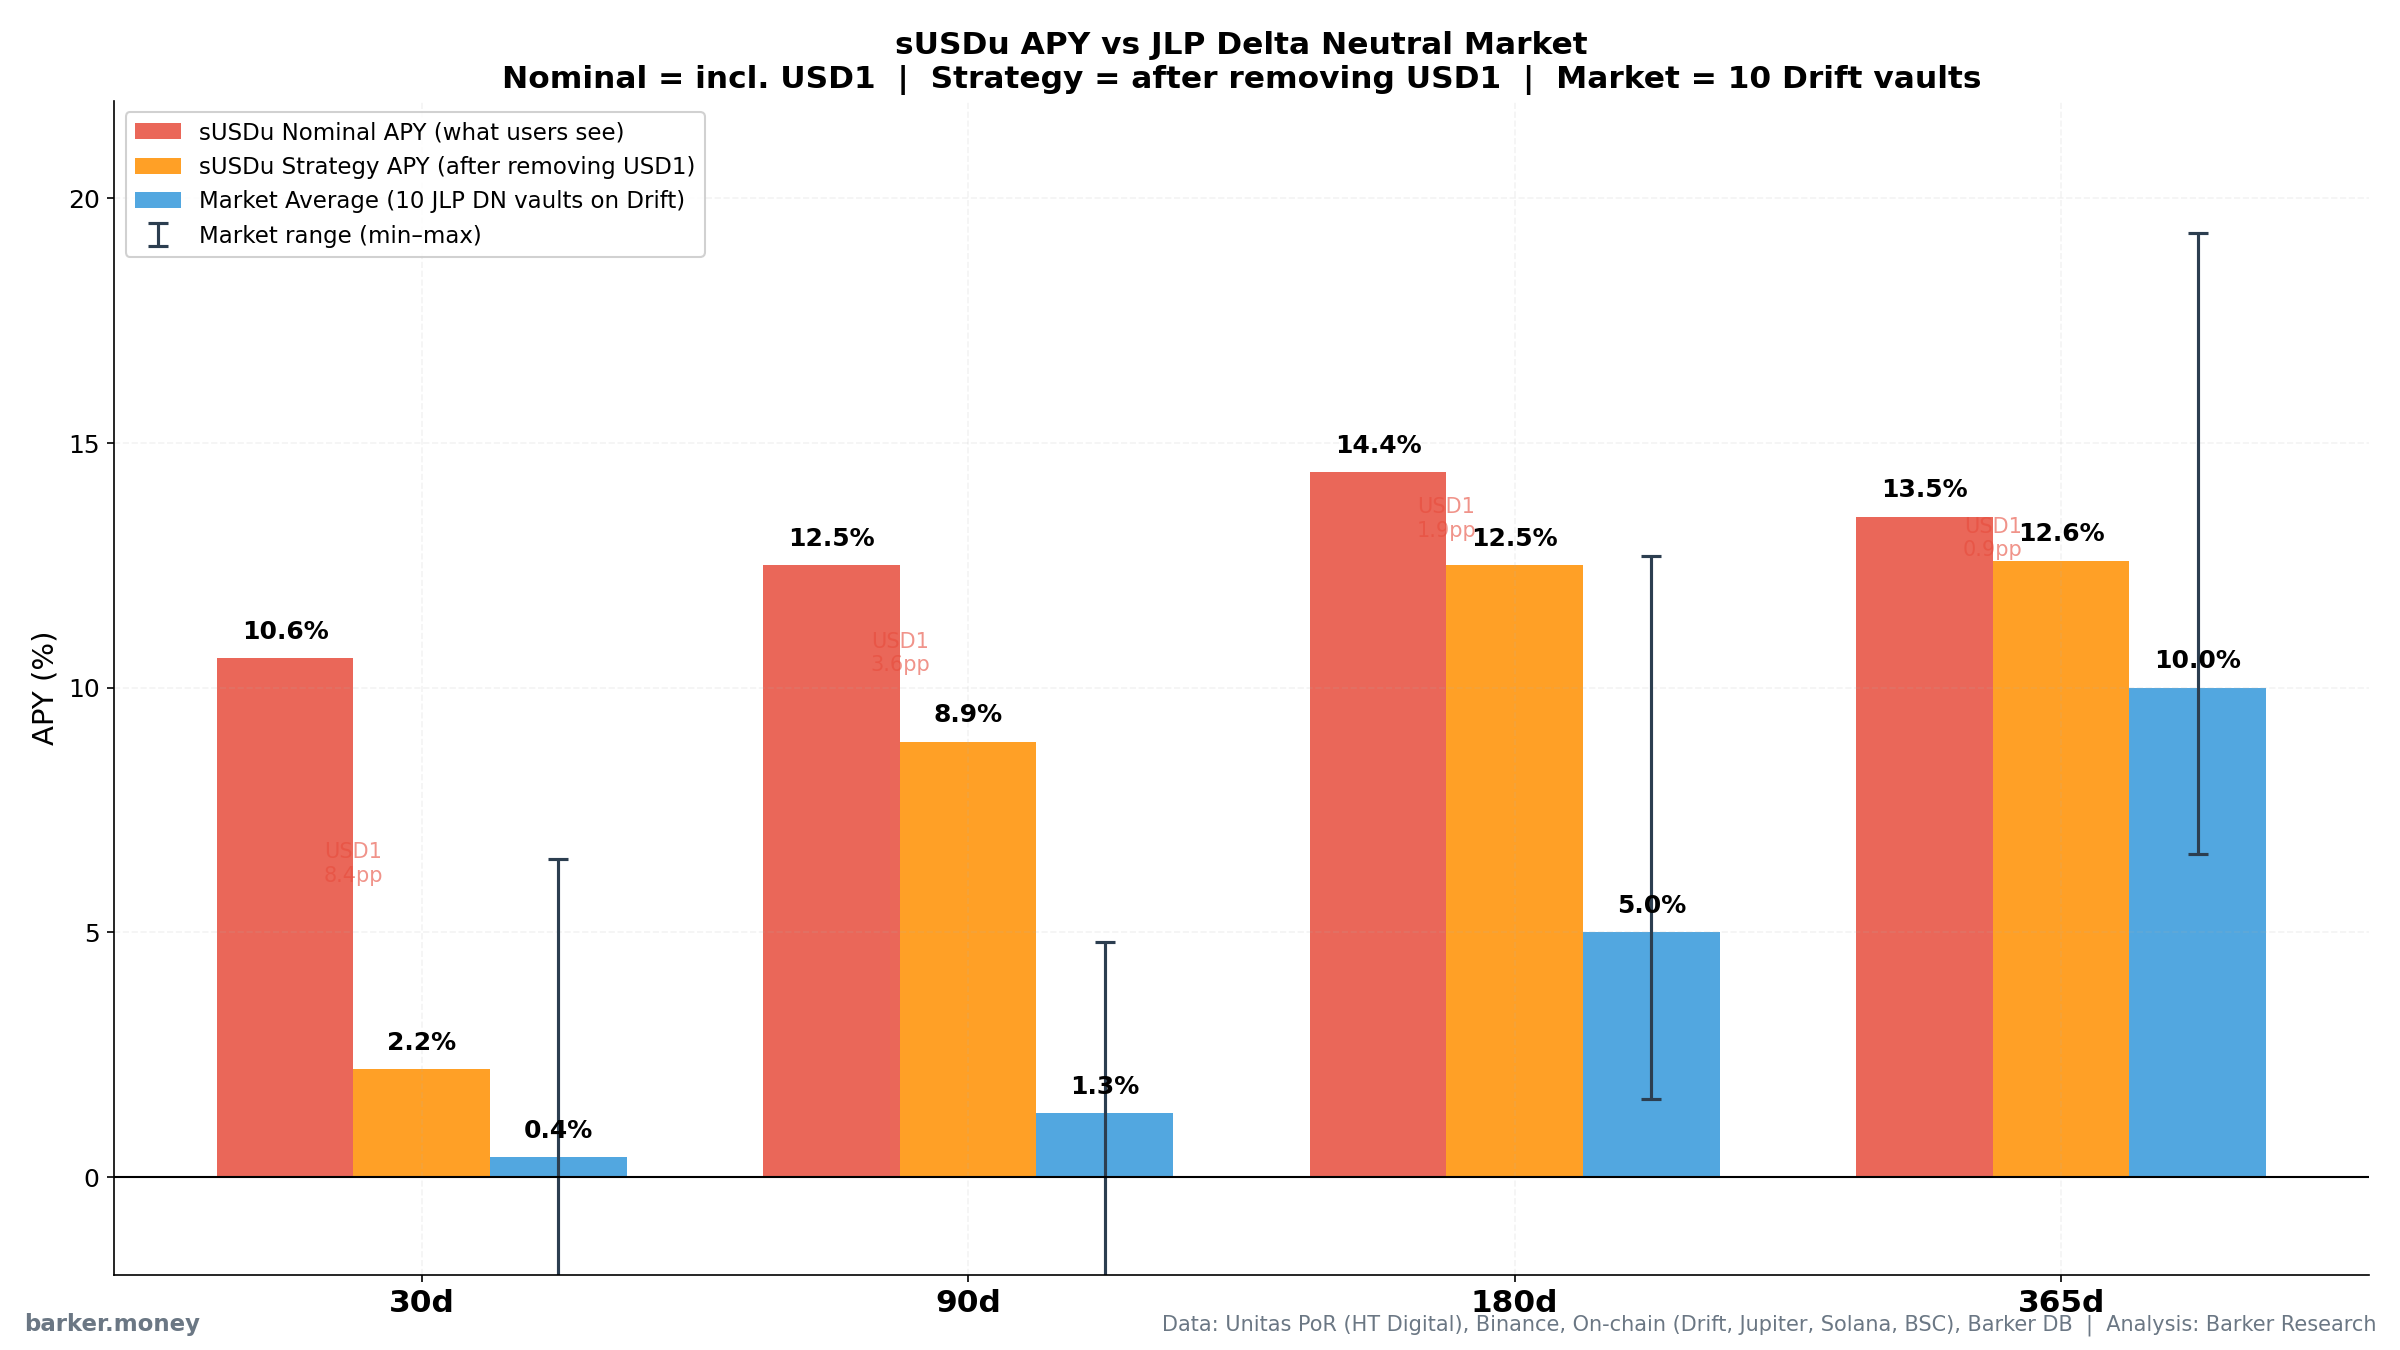
Chart: sUSDu vs market across four time windows. Red = nominal APY (what users see), orange = strategy APY (after removing USD1), blue = market average of 10 vaults. Error bars show market min–max range.
| Window | sUSDu Nominal | sUSDu Strategy (−USD1) | Market Avg | Gap |
|---|---|---|---|---|
| 30d | 10.6% | 2.2% | 0.4% | +1.8pp |
| 90d | 12.5% | 8.9% | 1.3% | +7.6pp |
| 180d | 14.4% | 12.5% | 5.0% | +7.5pp |
| 365d | 13.5% | 12.6% | 10.0% | +2.6pp |
Key observations:
At the 30-day horizon, strategy APY after removing USD1 is 2.2% versus a peer average of 0.4%—a noticeable spread, but not an extreme outlier on its own. Still, this is only the most recent window, and USD1 campaign income contributed nearly 80% of revenue, masking the strategy's underlying performance.
At 90 and 180 days, the gap exceeds 7 percentage points. That is substantial: over those horizons, Unitas's strategy APY (after removing USD1) outpaced the average of the ten peer vaults we track by more than seven percentage points.
At 365 days, the gap narrows to 2.6 percentage points. Some market vaults have also achieved 10%–13% annualized returns. But the critical difference is: market strategies' high returns come with massive volatility (30-day APY ranging from -4.5% to +6.5%), while sUSDu remains perfectly smooth.
What Happened During the Market Crash
Zooming into week-by-week comparisons, the contrast becomes even starker. The table below shows Unitas strategy performance versus Jupiter and Gauntlet across three periods with overlapping data:
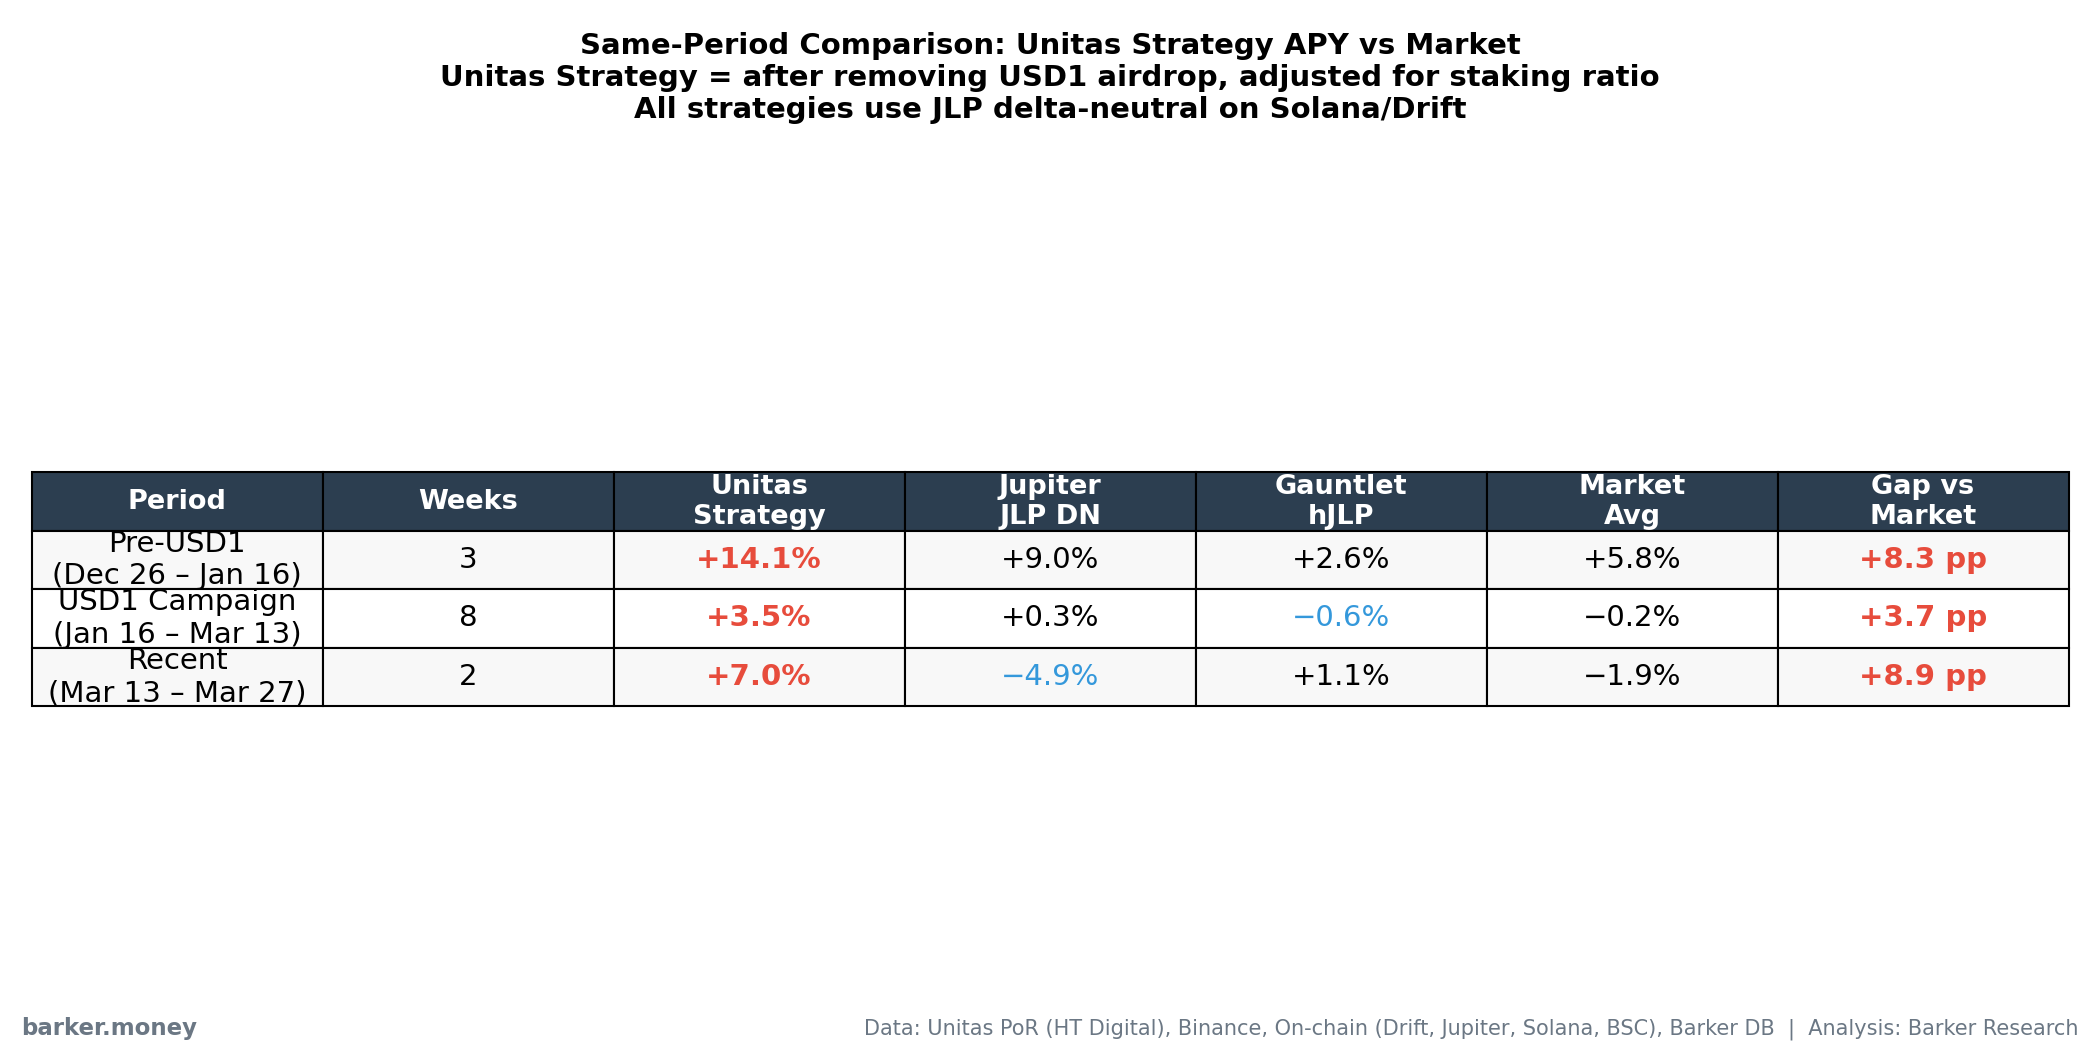
Table: Same-period strategy APY comparison across three phases. Unitas Strategy = after removing USD1 campaign income.
A concrete example: During the sharp market volatility in early February 2026 (1/30–2/6), Jupiter JLP DN lost 0.74% in a single week, Gauntlet hJLP lost 0.61%, while Unitas's strategy was virtually flat (-0.004%). In a week where every comparable strategy was taking losses, Unitas barely moved.
This is not an isolated incident. Across the 14 weeks of overlapping data we tracked, whenever market strategies posted losses, Unitas consistently performed more smoothly, either with significantly smaller drawdowns or maintaining positive returns against the trend.
This is the core issue. Outperforming peers by two to three percentage points for a while can be chalked up to execution edge. But posting positive returns for 19 consecutive months without a single monthly loss, while scaling from $25M to nearly $100M, in a strategy class where 30-day APY routinely swings through a ten-point range—that is statistically extraordinary.
Our View
Our analysis points to a "no matter how you explain it, there's a problem" conclusion:
1. Even after removing USD1 campaign income, there is a significant amount of unexplained yield.
USD1 Earn campaigns have indeed contributed substantial interest income to sUSDu (currently over 50% of total), but this only explains part of the picture. After removing USD1 income, sUSDu still outperforms comparable market strategies by over 7 percentage points at the 90-day and 180-day horizons. More importantly, 19 months of zero losses, in a strategy category where all peers experience sharp volatility, is difficult to attribute to "execution edge" alone.
JLP Delta Neutral is fundamentally a highly commoditized strategy. The underlying logic is publicly known, multiple teams execute the same approach, and the revenue source is Jupiter's perpetual exchange fee pool. For Unitas to consistently outperform by 7 percentage points on top of this, they would need to layer an exceptionally strong alpha on top of their delta hedge, an "alpha on top of alpha." Maintaining this dual outperformance while scaling from $25M to $100M for 19 months without a single miss requires far more transparent explanation than currently available.
2. Even assuming this outperformance ability is real, sUSDu's APY will decline significantly.
Over half of the current 12% APY comes from USD1 Earn campaign interest subsidies. This is a temporary income source. APR has already fallen from 19.46% at launch to 6.52%, and continues to decline. Even if Unitas's strategy execution is genuinely superior, once the USD1 campaign ends, this subsidy drops to zero, and sUSDu's yield is expected to fall substantially from its current 12%.
3. This entire analysis is based on Unitas's own publicly disclosed data.
All data we used (PoR audit reports, exchange_rate, official documentation) comes from Unitas's public channels. We cannot independently verify sUSDu's actual yield on-chain (the exchange_rate is set by the protocol's backend, not computed automatically by an on-chain contract).
If our analysis contains any errors in understanding or calculation, we sincerely welcome the Unitas team to respond publicly and point them out. Unitas does better than many protocols on disclosure, regularly publishing third-party audited PoR reports and maintaining a transparency page. But frankly, Unitas is not our biggest concern. In the DeFi yield market, a large number of products lack even basic disclosure of their yield sources, with no audits, no PoR, and no traceable on-chain data. Users have no way to judge where their money goes or where yield comes from. Those products pose a far greater risk.
Barker.Money, your one-stop stablecoin yield map, helping individual users discover safe and relatively high-yield stablecoin opportunities across exchanges and on-chain protocols. This is the first report in our "DeFi Yield Product Deep Dive" series. We have already completed in-depth analyses of additional yield-bearing stablecoins and DeFi yield pools, which will be published in upcoming reports.
We also welcome community members to contribute their own independent analyses. Let's push this industry toward higher transparency standards together.
Appendix
A. Methodology
Data Sources:
- sUSDu exchange_rate and monthly returns: Unitas official website
- Collateral composition: Unitas PoR Audit Reports (HT Digital, published weekly)
- USD1 Earn campaign APR: Binance official announcements
- JLP DN strategy performance: Drift on-chain data
- Jupiter / Gauntlet share price: Daily manual collection
- sUSDu / USDu token supply: Solana RPC, BSC RPC (Alchemy)
- sUSDu TVL historical snapshots: Barker DB
Strategy APY Calculation:
We derive total protocol revenue from the weekly change in sUSDu exchange_rate, subtract USD1 Earn campaign interest (Binance announced APR × USD1 holdings from PoR audit), to isolate pure strategy income. Dividing by total collateral gives the strategy APY. Formula:
protocol_revenue = exchange_rate_change × USDu_circulation × staking_ratio / 0.80
usd1_income = USD1_holdings × Binance_APR × days / 365
strategy_income = protocol_revenue − usd1_income
strategy_apy = strategy_income / total_collateral × 365 / days × 100
The staking_ratio is derived from BSC on-chain sUSDu totalSupply + Barker DB Solana sUSDu TVL snapshots, divided by USDu circulation from PoR reports.
B. Complete USD1 Earn Campaign APR Record
| Period | Round | Boosted APR | Base APR |
|---|---|---|---|
| 1/23–1/30 | R2 | 19.46% | 16.22% |
| 1/30–2/06 | R2 | 15.13% | 12.60% |
| 2/06–2/13 | R2 | 13.59% | 11.32% |
| 2/13–2/20 | R2 | 13.81% | 11.51% |
| 2/20–2/27 | R3 | 8.18% | 6.82% |
| 2/27–3/06 | R3 | 8.39% | 6.99% |
| 3/06–3/13 | R3 | 8.52% | 7.10% |
| 3/13–3/20 | R3 | 8.08% | 6.74% |
| 3/20–3/27 | R4 | 6.52% | 5.43% |
Source: Binance official announcements. Boosted APR applies to contract accounts (1.2x multiplier).
C. Full JLP DN Strategy Performance
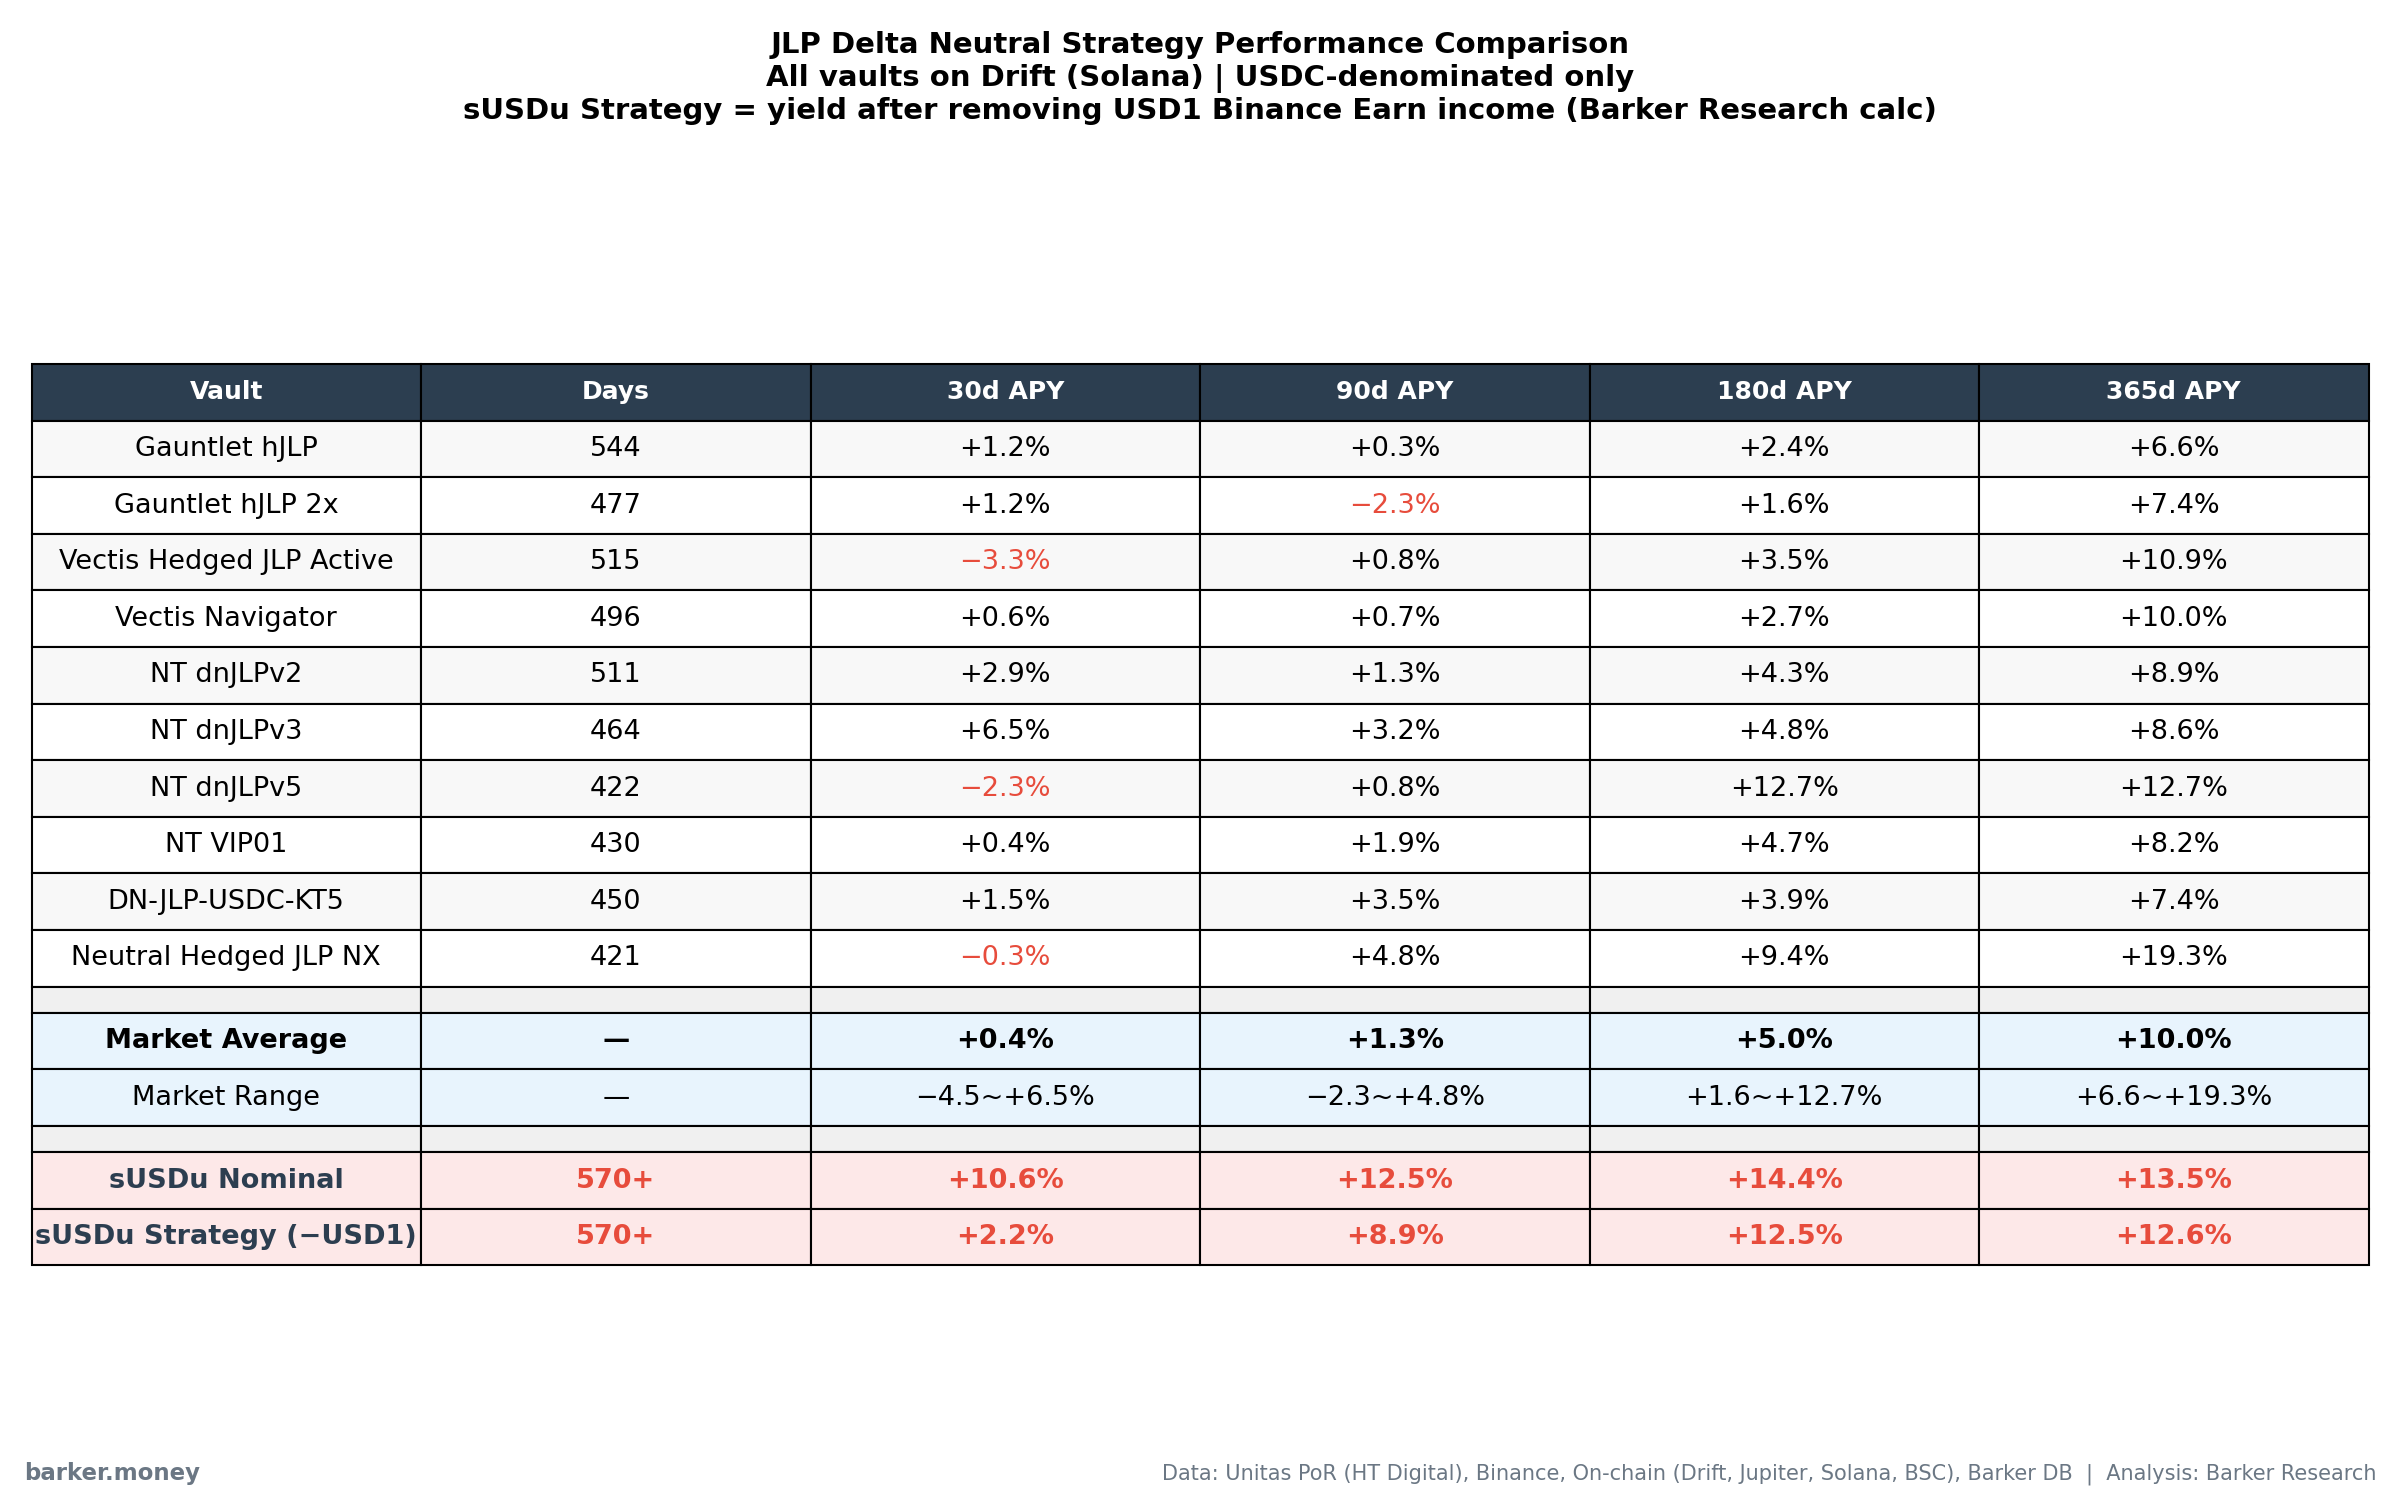
Table: 30d/90d/180d/365d APY for 10 USDC-denominated JLP Delta Neutral vaults on Drift, compared with sUSDu. Data source: Drift on-chain API, as of March 30, 2026.
D. sUSDu Monthly Returns
| Month | Return | Month | Return |
|---|---|---|---|
| 2024-08 | +0.69% | 2025-06 | +0.92% |
| 2024-09 | +1.77% | 2025-07 | +1.11% |
| 2024-10 | +2.05% | 2025-08 | +1.52% |
| 2024-11 | +2.99% | 2025-09 | +1.40% |
| 2024-12 | +3.22% | 2025-10 | +1.33% |
| 2025-01 | +1.16% | 2025-11 | +1.07% |
| 2025-02 | +0.88% | 2025-12 | +1.15% |
| 2025-03 | +0.77% | 2026-01 | +0.94% |
| 2025-04 | +0.72% | 2026-02 | +0.88% |
| 2025-05 | +0.93% |
Source: Unitas official website. 19-month cumulative return: +28.77%, annualized ~17.3%. Zero monthly losses.
Data sources
Unitas PoR Audit (HT Digital), Binance Official Announcements, On-chain Data (Drift, Jupiter, Solana RPC, BSC RPC), Barker DB